Can you determine school performance with no access to scores? Here’s one novel idea
Editor’s Note: This article originally appeared on the Cloudera Foundation website. In April 2021, the Cloudera Foundation merged with the Patrick J. McGovern Foundation.
by Heather Baier, Dan Runfola
Dec. 20, 2019
William & Mary geoLab shares early results of student-led machine learning experiment
BACKGROUND
One of the largest barriers to assessing student and school performance is a lack of accurate and standardized data — and the high costs of acquiring the data that does exist. This is a particularly pressing challenge in the developing world, where international donors seek to efficiently target aid efforts toward those most in need.
THE PROJECT
The students at the William & Mary geoLab have partnered with the Cloudera Foundation to explore the potential value of a machine learning and data analytics incubator for the international development community. As an initial, test step toward this goal we are investigating the use of convolutional neural networks to overcome the school data gap with a test case in the Philippines. This project was designed with and supports ongoing activities by the NGO CheckMySchool.
THE CHALLENGE
Currently, CheckMySchool collects data predominantly from two sources: government records and surveys provided by volunteers. This data is collated into metrics for each of approximately 44,751 public elementary and secondary schools across the Philippines. Information integrated includes, for example, the number of seats available, remoteness and accessibility, physical quality of classroom infrastructure, and — most importantly for this study — information from a standardized test called the NAT.
The NAT provides a powerful measure for donors seeking to identify what school(s) to invest in; however the usefulness of the NAT is mediated by the challenge of acquiring the data. Of the 44,751 schools in the Philippines, NAT score data is only available for 7,187 of them during the 2013–2014 school year — and those were only acquired through Freedom of Information requests to the Philippine government.
In an attempt to provide more regular, contemporary estimates of NAT for every school, we explored using convolutional neural networks. Building on CheckMySchool’s theory that educational outcomes are tied to the quality of physical infrastructure, convolutional neural networks provide a programmatic way to detect features in imagery that are useful for prediction. For example, proximity to roads, roof type, playground presence, and many other items could be correlated with outcomes.
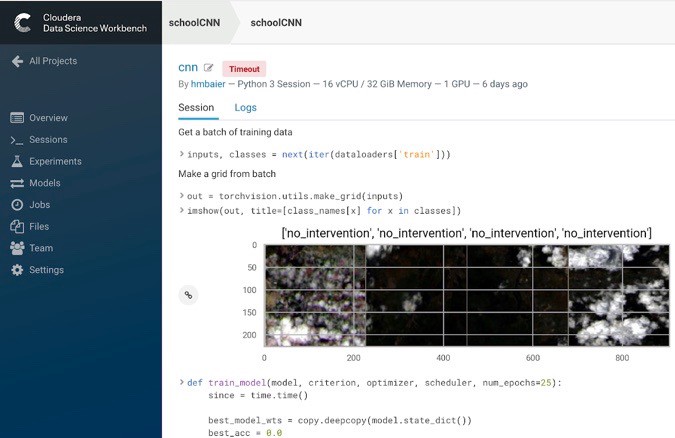
In our current model implementation, we are able to predict with approximately 80% accuracy if a school falls into a “warning” category — i.e., a school that falls below average on the NAT — using only imagery of the school. One undergraduate student at William and Mary implemented this model — including all data acquisition pipelines — in python over a ~1 month period on the Cloudera Data Science Workbench; it leverages 1 of the 2 NVIDIA V100 GPUs installed on our cluster. Time from idea to initial prototype on CDSW was approximately 1.5 weeks.
THE MODEL
In our current modeling approach, we use an ensemble of three models to predict NAT scores for 7,187 schools :
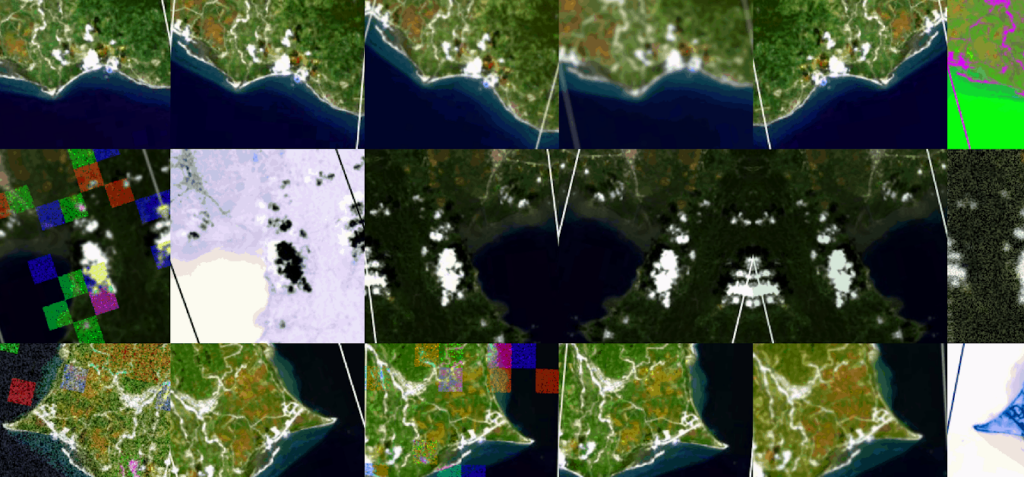
Ensemble Member 1 leverages Landsat satellite data taken between June 2013 and April 2014 (corresponding to the Philippine school year), which provides coarse resolution top-down views of every school. We retrieve 224×224 windows of pixels with the school as the center point for every image, resulting in a total region of roughly 6.7 square kilometers around each school. This model is hypothesized to be effective at correlating broad regional factors (such as road networks) with school outcomes.
Ensemble Member 2 leverages contemporary Google maps imagery, using a zoom level of 17 centered on each school to identify high-resolution features that may be relevant to the prediction of NAT scores. This model is hypothesized to be effective at correlating school-specific factors (i.e., roof quality; playground presence) with school outcomes. Because only contemporary imagery is available, we make the assumption that the on-the-ground nature of the schools being observed has not changed (much) since the testing occurred in 2013–14; we will test this assumption in the future as more contemporary information becomes available via future FOI requests.
Ensemble Member 3 uses imagery retrieved from the Google street view API. Imagery from 4 headings (north, south, east and west) is retrieved for the 2,579 schools for which street view imagery was available. Further, for schools that do not have street view information we save a special value to indicate the lack of street view data — as the lack of such data may be important indicators of school accessibility. Similar to ensemble member 2, we make the assumption that the on-the-ground imagery of schools has not changed significantly between when test scores were recorded and when the google street view imagery was acquired.
For each school, we define success using the results of the Philippines NAT for grades 6 and 10 for the 2013–2014 school year (representing all available data from current FOI requests). Students take either five or six subject tests depending on their grade level and these scores are averaged into an overall mean NAT score per school. The mean scores range from 11.18 to 46.32 and a kMeans break at 27.6 splits schools into two classes: schools scoring below 27.6 are labeled 1, or in need of an intervention, and schools scoring above 27.6 are labeled 0. Our final model predicts whether students at a school will score above or below 27.6 on the average of all their NAT exams.
Each member of our model ensemble was first calibrated independently, with the goal of predicting the binary value described above. For Ensemble Member 1 (Landsat / coarse resolution satellite imagery), we identified the ResNeXt-101–32x8d model as the best performing using weights from ImageNet as the starting point for model refinement. This resulted in the highest accuracy we achieved for an individual ensemble member, 77.26%. Ensemble Member 2 (Google Maps / high resolution satellite imagery) achieved a maximum accuracy of 67.27% using a ResNet152 model (4 training epochs), and Ensemble Member 3 (Google street view) reached a maximum individual accuracy of 64.93% (7 training epochs).
These individual ensemble members are combined using a stacked generalization approach, in which the soft-classification probabilities estimated by each ensemble member are fed forward into a secondary, “meta” classifier. After testing numerous ensemble models, we narrowed them down to Nearest Neighbors, Random Forest and Decision Tree. An exhaustive grid search on our top three models identified Nearest Neighbors as the best overall model with an accuracy of 79.90% with uniform weights and 11 nearest neighbors.
NEXT STEPS
Moving forward, we hope to acquire more NAT results to further augment our dataset, as well as test different CNN architectures, image transformations, and additional training epochs as hardware allows. The results of the project will be shared with CheckMySchool to provide a tool that will allow decision makers to make predictions about a school’s success to prompt intervention for low-performing schools not on their radar. Ongoing work into the capability of stacked ensemble regression approaches is also proving positive, suggesting that with further refinement similar models may be able to estimate a school’s score, rather than above-or-below class membership. Finally, we are going to continue to seek different scales of imagery for input into the ensemble, hoping to detect new features (i.e., stadiums) that may be difficult to identify in the current scales being leveraged.
CHECKMYSCHOOL’S PERSPECTIVE
“In the Philippines, the need to assess school-level outcomes and discussions on interventions have been the recent buzzwords in light of the country’s poor ranking in the 2018 PISA,” said CheckMySchool Project Coordinator Wilson Villones. (PISA is the Programme for International Student Assessment, which measures student proficiency in reading, mathematics and science.) “But accessing the data on school outcomes has been especially difficult as researchers are limited to acquire only 10% of the data and this comes with administrative fees.”
“Seeing the initial results of CNN research being developed by geoLab, we can now have a strong and concrete foothold to assess and identify schools needing interventions, not just to improve our PISA ranking or for any short-term fixes, but ultimately to improve the lives of children in the Philippines. The final result of this CNN research is really enticing.”
Heather Baier is a senior majoring in data science at William & Mary. She plans to graduate in May 2020.
Dan Runfola is AidData’s Senior Geospatial Scientist and an Assistant Professor of Applied Science at William & Mary.